Does Modern Option Flow Still Predict Next-Session Stock Returns? A Replication of Pan & Poteshman (2006)
We replicate Pan & Poteshman (2006) using 188.5 million intraday option orders across 1,250 sessions (2021–2026). A three-stage validation framework (IS1/IS2/OOS) across 216 signal configurations finds that Call Imbalance in OTM institutional blocks delivers out-of-sample Sharpe ratios of 1.6–1.8, while composite directional signals and buy-side-only pressure are eliminated entirely.
188.5M
Orders Analyzed
1,250
Trading Sessions
216
Configs Tested
3
OOS Winners
Key Findings
Call Imbalance Is the Robust Signal
Two S2_cw (Call Imbalance, confidence-weighted) configurations pass out-of-sample with Sharpe ratios of 1.81 and 1.61, delivering cumulative L/S returns of +107.9% and +92.6% over ~20 months. The signal strengthened from IS2 to OOS.
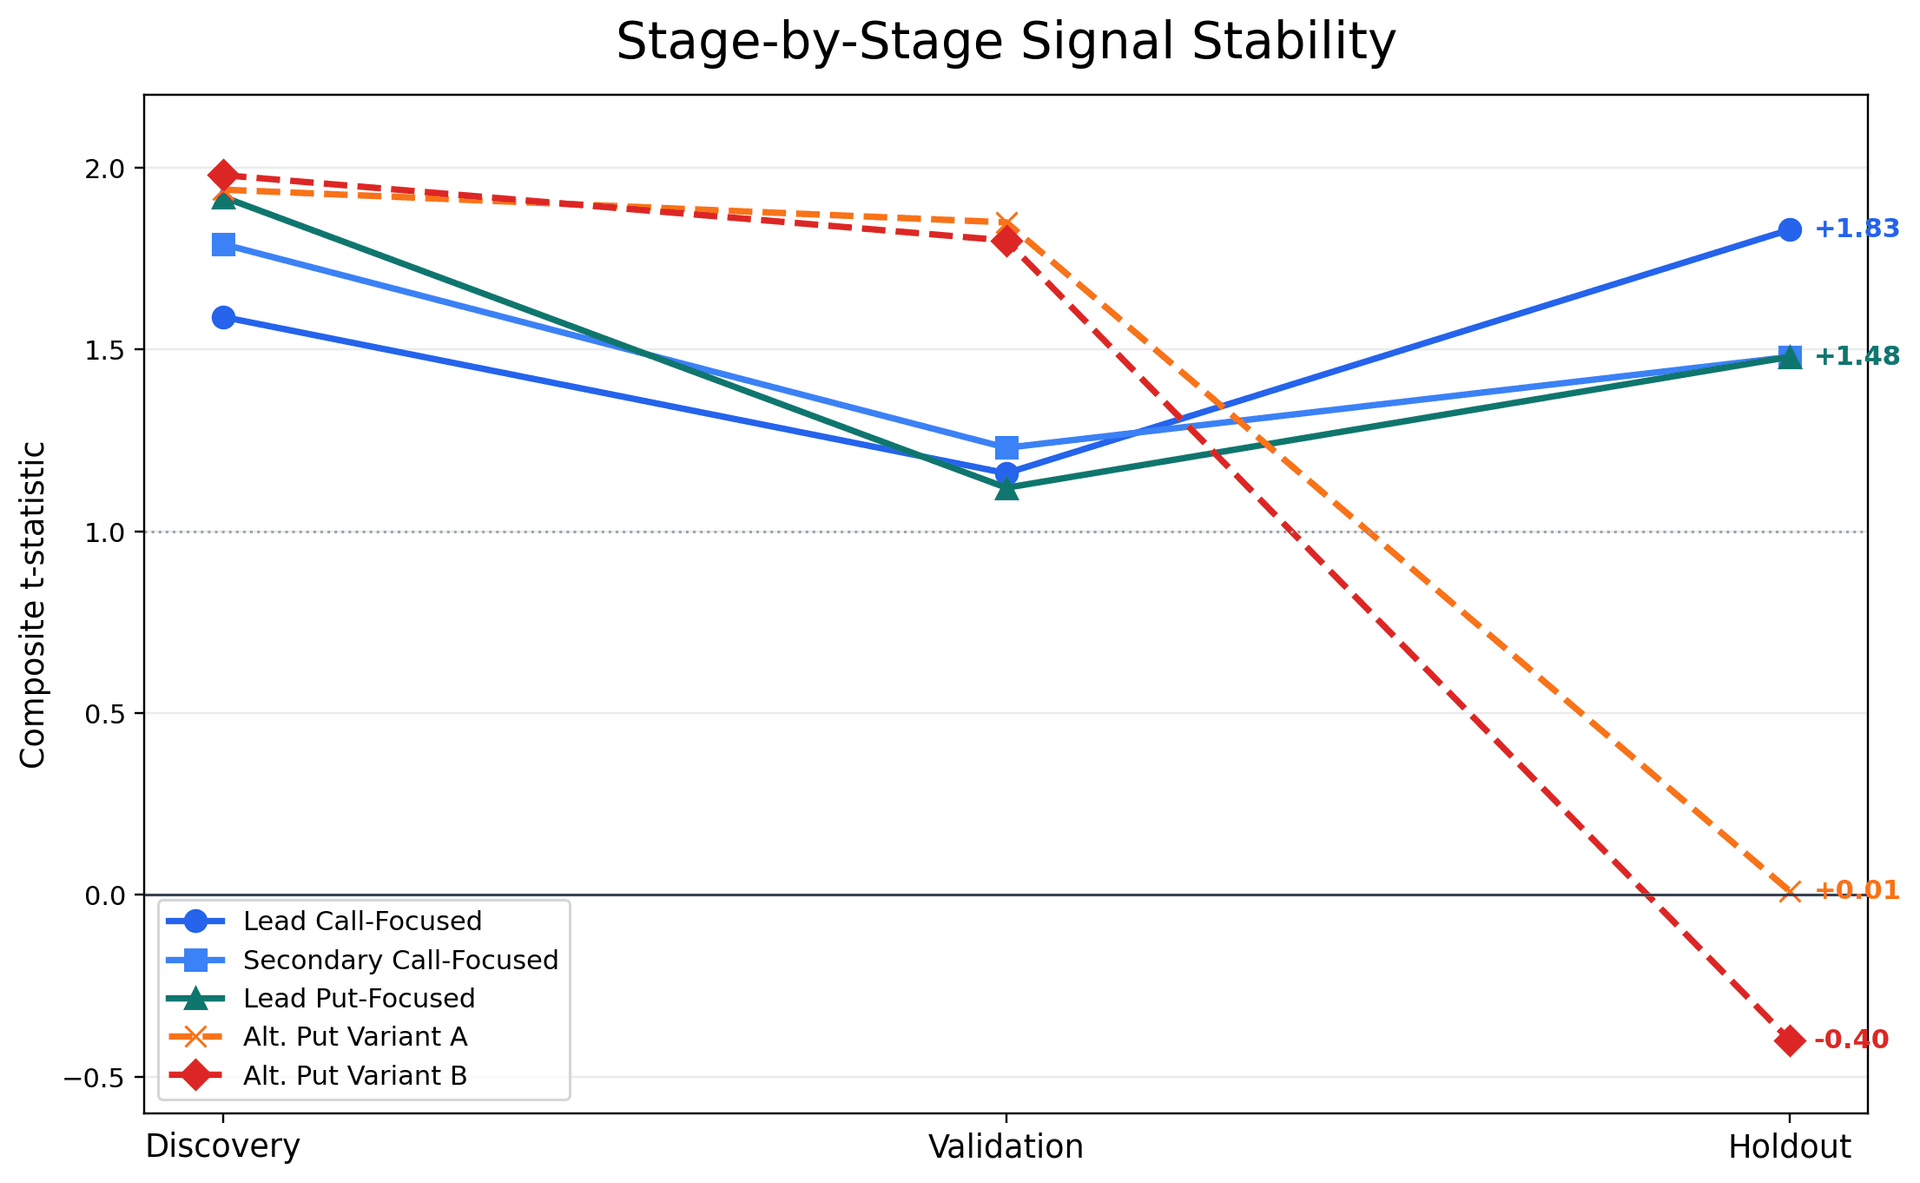
Figure — t-statistic progression across three validation stages for all 5 selected configurations. Passing configs shown with distinct markers.
Three-Stage Validation Prevents Overfitting
216 configurations are screened through IS1 (train), IS2 (validate), and OOS (test). 70% of IS1 survivors fail IS2. The two configs with the strongest IS1/IS2 t-statistics both failed OOS — demonstrating the value of multi-stage validation over pure in-sample ranking.
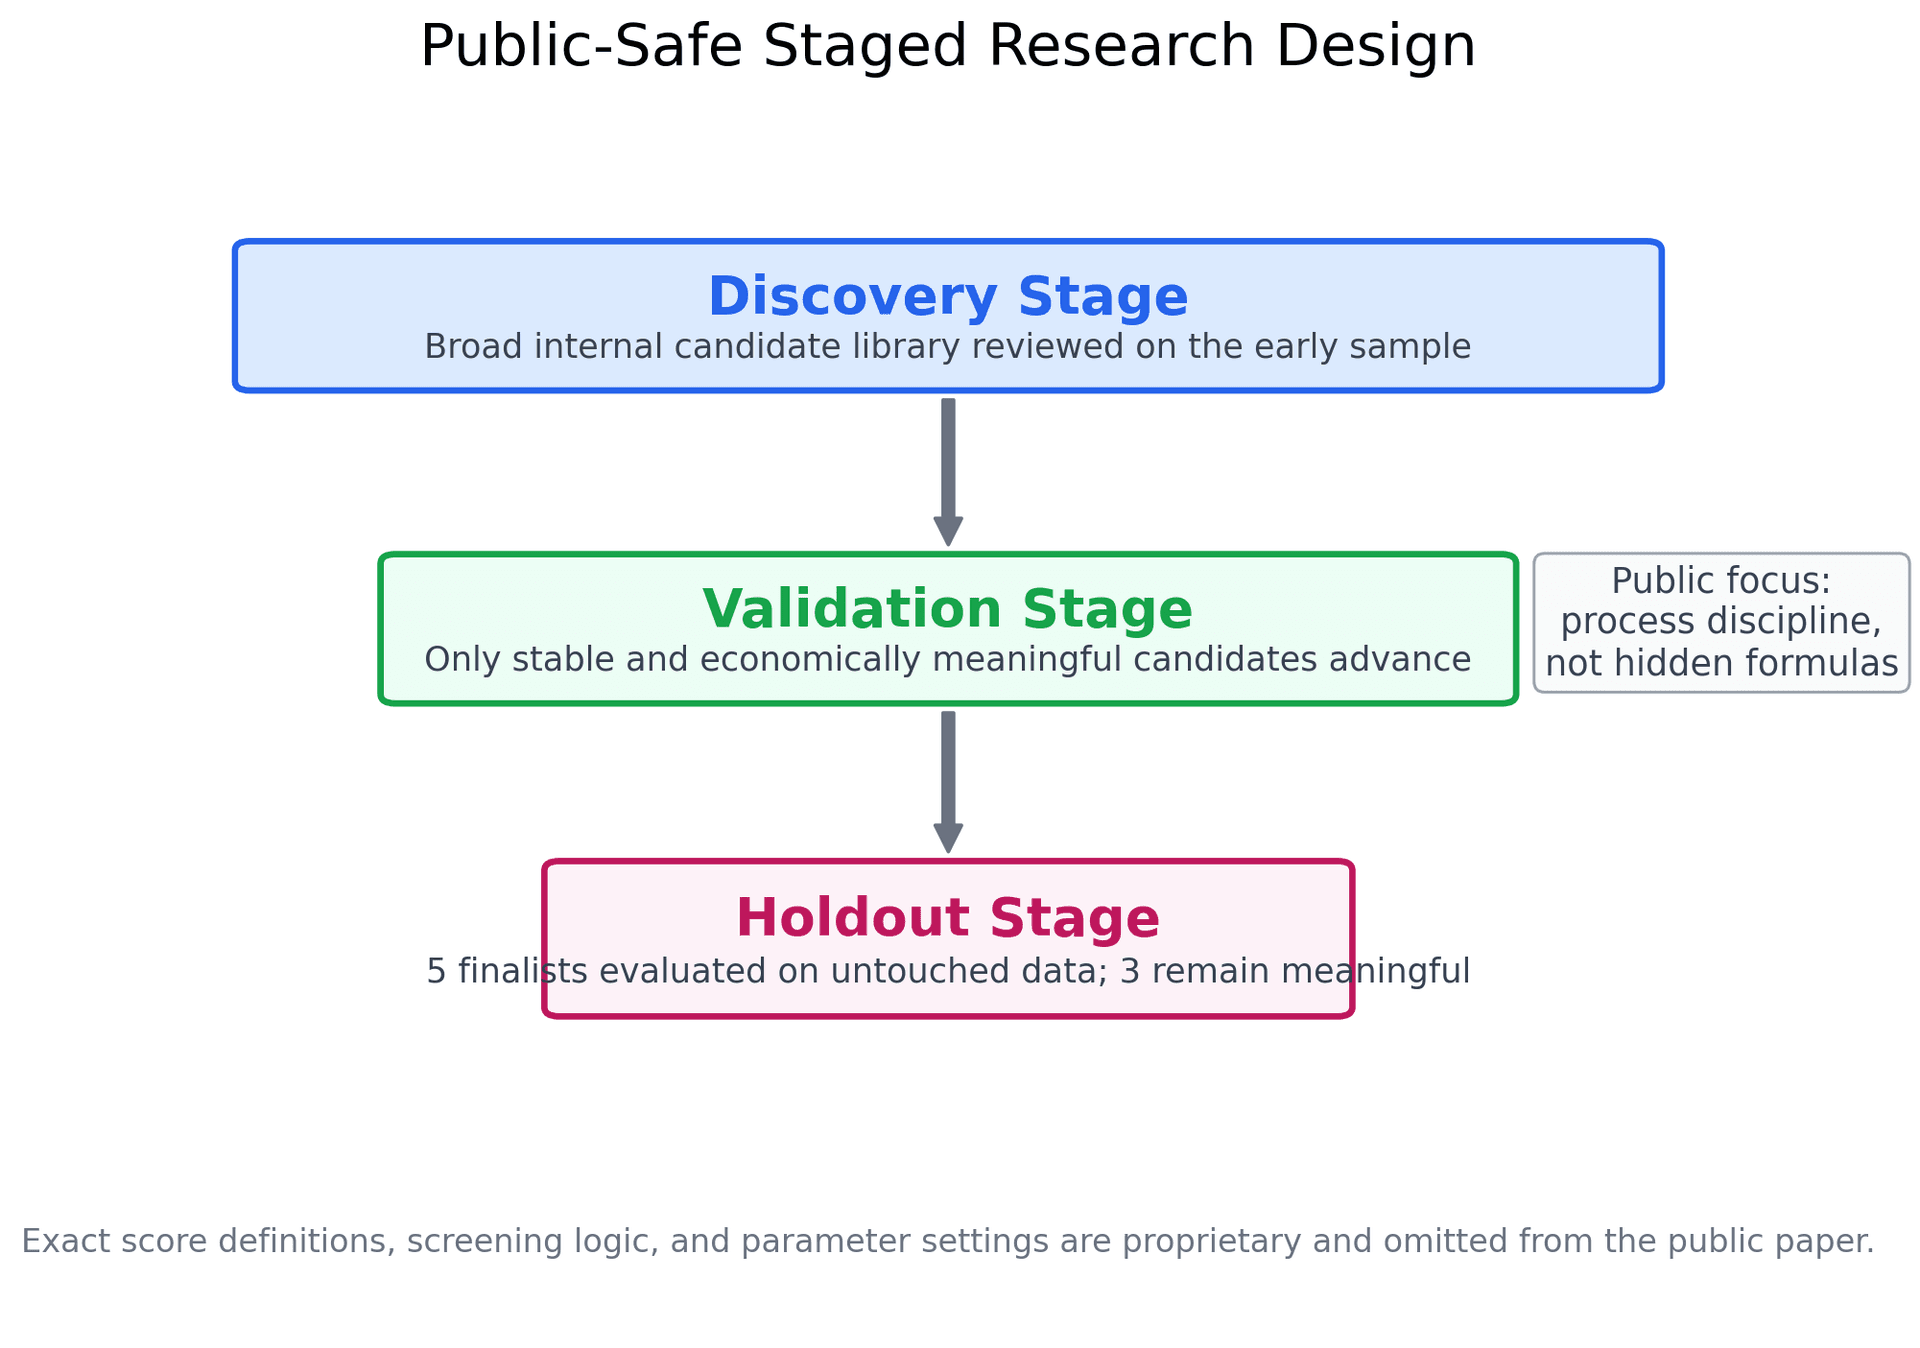
Figure — Selection funnel: 216 → 30 → 9 → 5 → 3 surviving configurations.
Strong Out-of-Sample Holdout Performance
The three passing configurations generated sustained positive performance over the 416-session OOS holdout (~20 months), with the best config (S2_cw_all_otm_c1000) reaching +107.9% cumulative. The two failing S3 configs hovered near zero, confirming IS2 correctly filtered fragile signals.
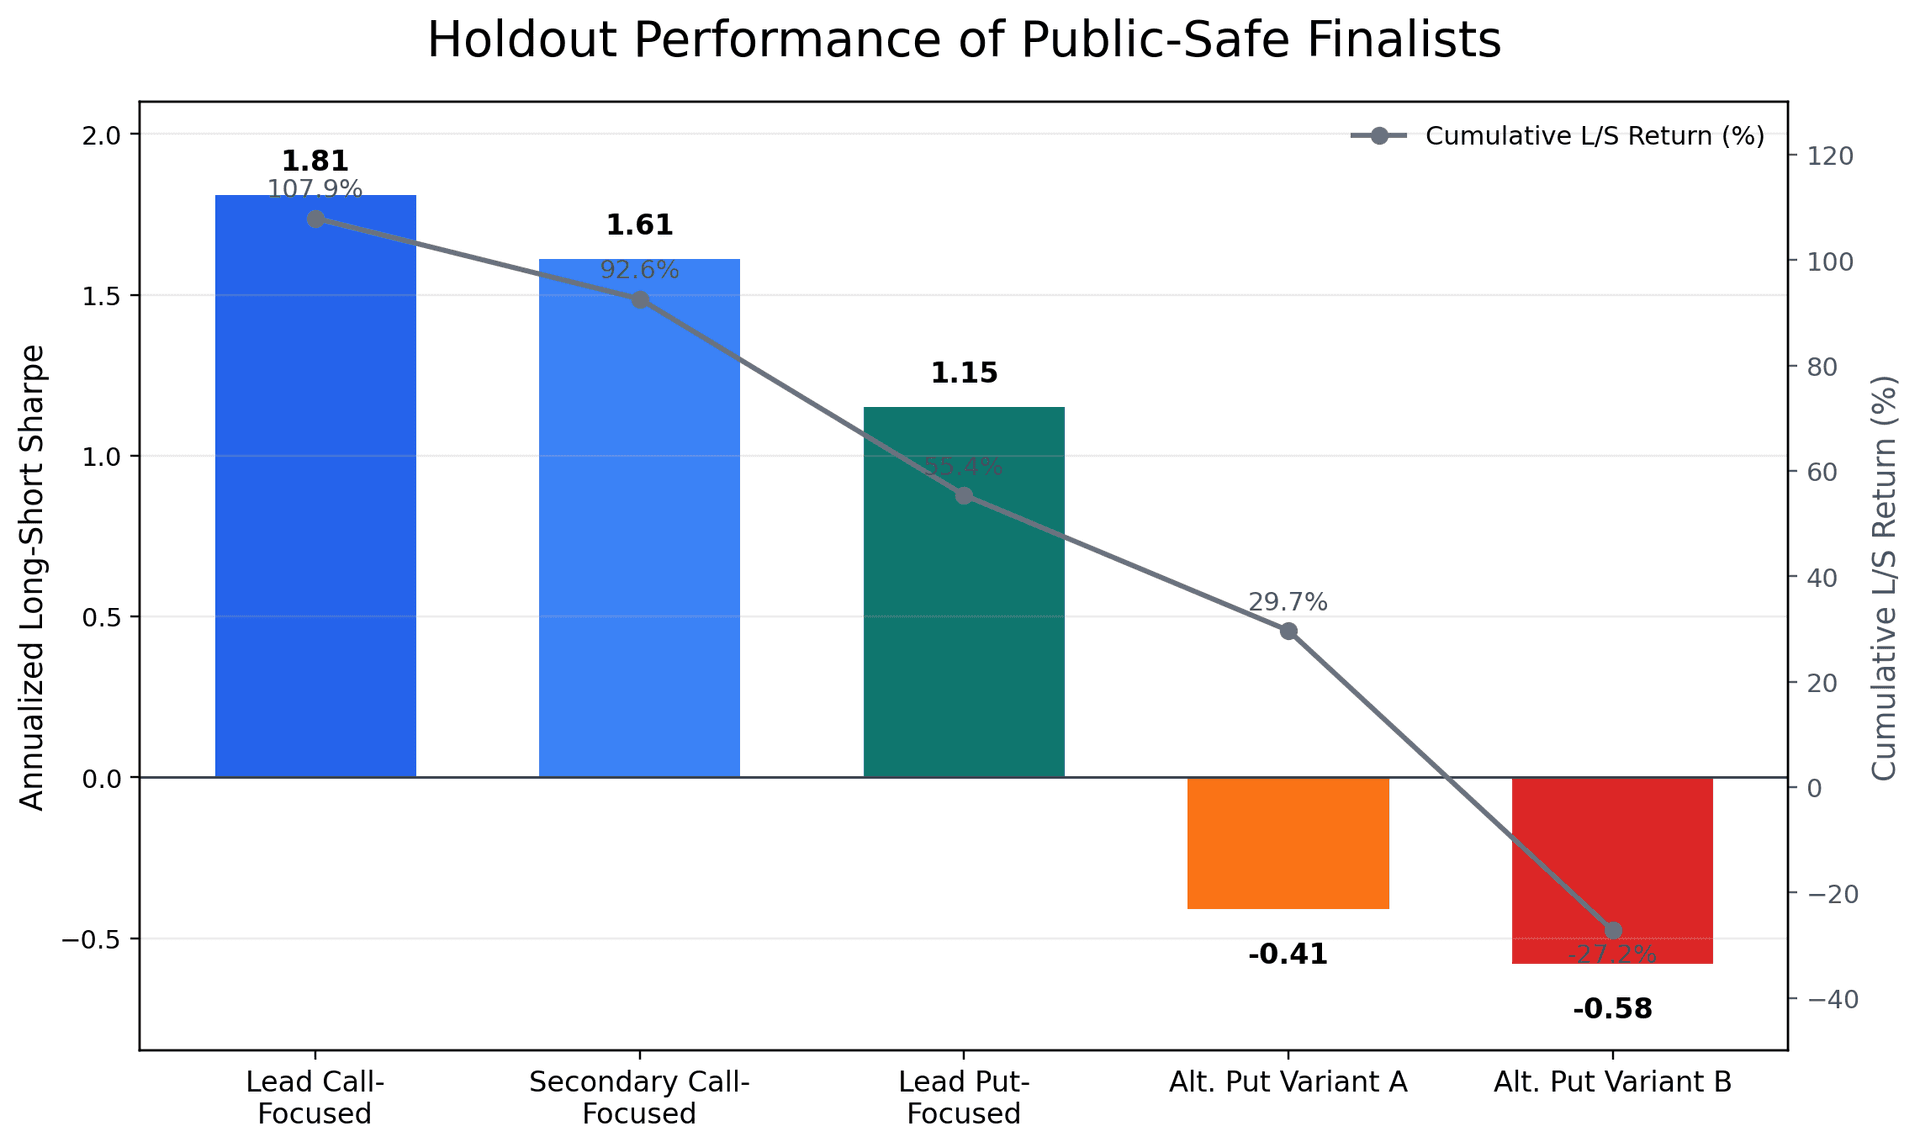
Figure — Out-of-sample holdout performance for the 5 selected configurations over 416 sessions.
Signal Concentrated in Large-Cap, High-Liquidity Names
Subsegment analysis shows Sharpe ratios up to 1.75 in large-cap stocks and 1.30 in high-liquidity names. The put imbalance signal (S3) reverses sharply in mid-cap (−3.98 Sharpe), suggesting put flow in smaller names reflects hedging rather than informed directional bets.
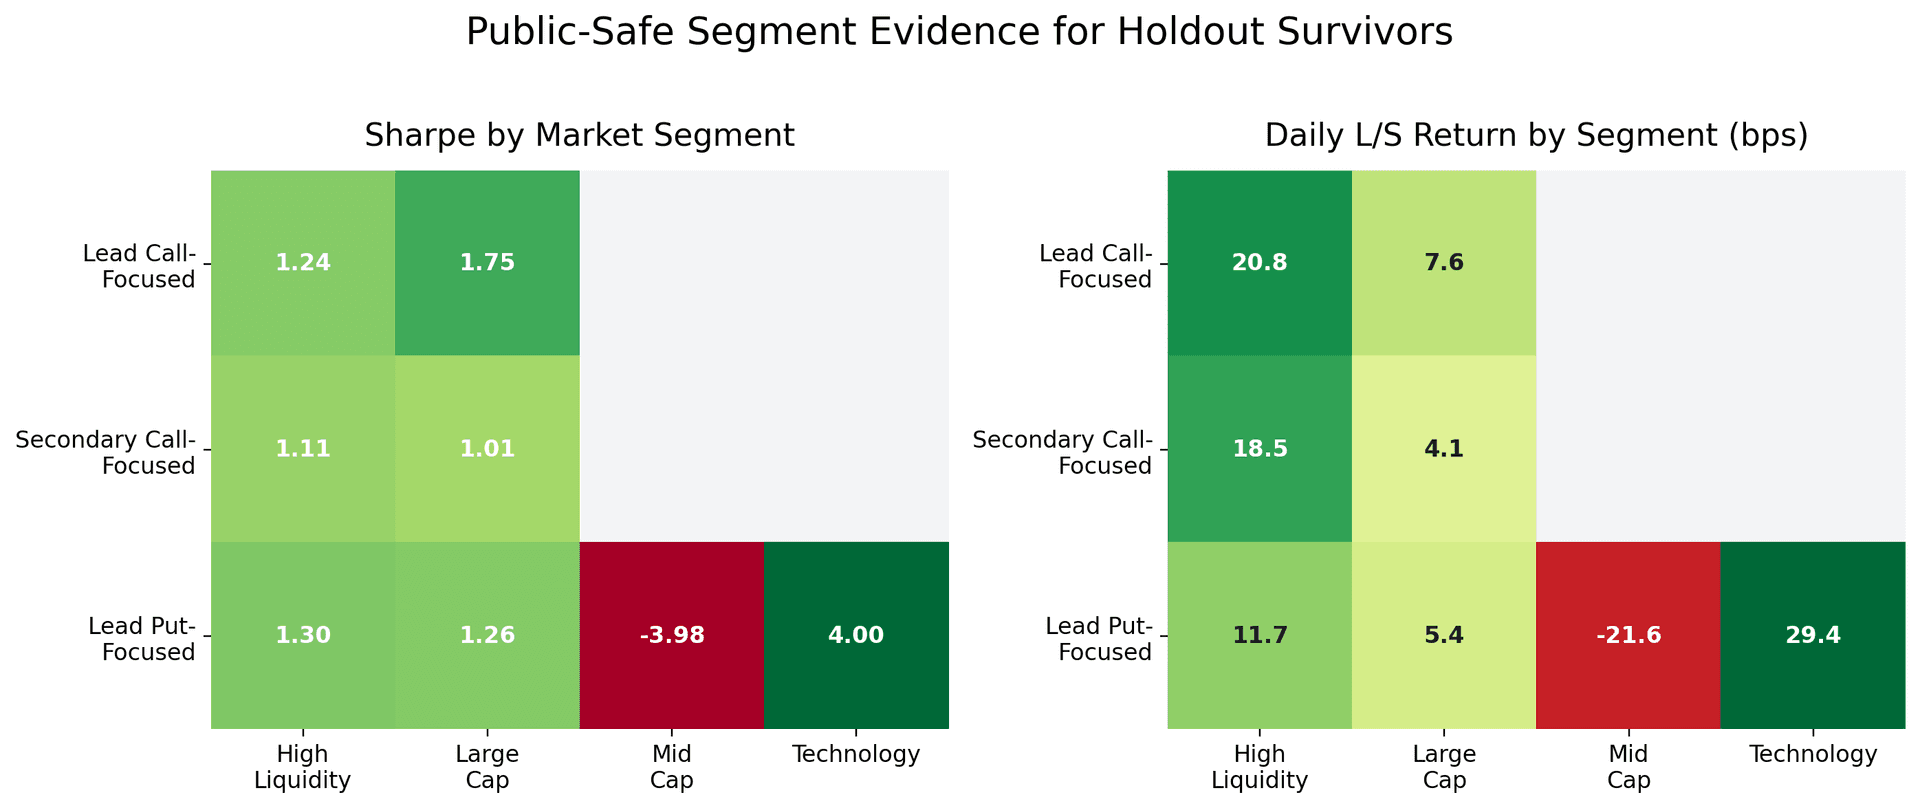
Figure — OOS Sharpe ratio and daily L/S return (bps) by market segment for the three winning configurations.
Call Imbalance Creates Bilateral Alpha
S2 winners generate genuine divergence: both long and short legs contribute (Long Sharpe ~2.2, Short Sharpe ~1.5–1.7). The failing S3 configs had positive individual-leg Sharpes but the L/S spread collapsed — the signal ranked extreme tickers similarly regardless of direction.

Figure — Long/short leg Sharpe decomposition showing bilateral alpha for S2 versus spread collapse for S3.
Data & Methodology
Replication of Pan & Poteshman (2006) using 188.5 million intraday large option orders (50+ contracts) from 2021-04-08 to 2026-04-07 across 1,250 trading sessions. A three-stage validation framework (IS1 train / IS2 validate / OOS test) screens 216 signal configurations down to 3 survivors. All data sourced from optionwhales.io proprietary flow collection infrastructure. See the full paper for complete methodology, signal definitions, and limitations.
Access the Data
The data behind this research is available through the OptionWhales platform. Track real-time large option flow, inferred strategies, and directional signals across every US-listed equity and ETF.
Continue reading